


02
JulA/B Testing for Data Science
02 Aug 2025
Beginner
3.04K Views
7 min read

Learn with an interactive course and practical hands-on labs
Data Science with Python Certification Course
Introduction
In data science for beginners, A/B testing is a powerful data science technique that assists organizations in optimizing their products and services and making data-driven decisions. A comparison of two variations, typically referred to as A and B, is necessary to determine which one performs better in terms of user engagement, conversion rates, or any other intended consequence. By allocating consumers at random to each version and then examining the results, this testing, often employed in Data Science Online Training, offers valuable insights into the effects of changes such as design modifications, feature additions, or pricing strategies.
What is A/B testing in Data Science?
This is a statistical technique used to compare the performance of two versions of a good or service. Data science employs it to enhance customer experience and optimize business decisions. A sample group is randomly split into two equal portions for A/B testing. Version A is given to one group, while Version B is given to the other group. The effectiveness of each version is then evaluated to decide which version is more effective.
This is used to examine many facets of a good or service, such as the user interface, pricing, marketing tactics, and features of the product. It is crucial to remember that this is an ongoing process of optimization rather than a one-time event.
Key terminologies used in testing
Understanding the following terms is essential before learning more about this testing.
- Hypothesis: A statement that anticipates the result of an experiment is referred to as a hypothesis. Before running an A/B test, a clear hypothesis must be established.
- Control group: Groups receiving the original iteration of a product or service are known as "control groups." The test group's performance is compared to that of the control group as a standard.
- Test group: A test group is a population that receives a product or service in a modified form. To establish which version performs better, the test group's performance is contrasted with that of the control group.
- Statistical significance: Statistical significance is a metric used to assess the likelihood that the results are not the result of chance. Statistical significance is utilized in testing to identify the version that performs better.
Read More - Best Data Science Interview Questions
Why A/B testing is important?
- It is essential for data science because it enables firms to make decisions based on data.
- Businesses can improve their goods and services through this testing, which boosts sales and enhances consumer happiness.
- Offering insightful information about client behavior also assists firms in avoiding costly mistakes.
- This is also more affordable than other methods for evaluating theories, such as focus groups and surveys.
- It delivers precise and trustworthy results that can be applied to make wise business decisions.
How to run A/B testing
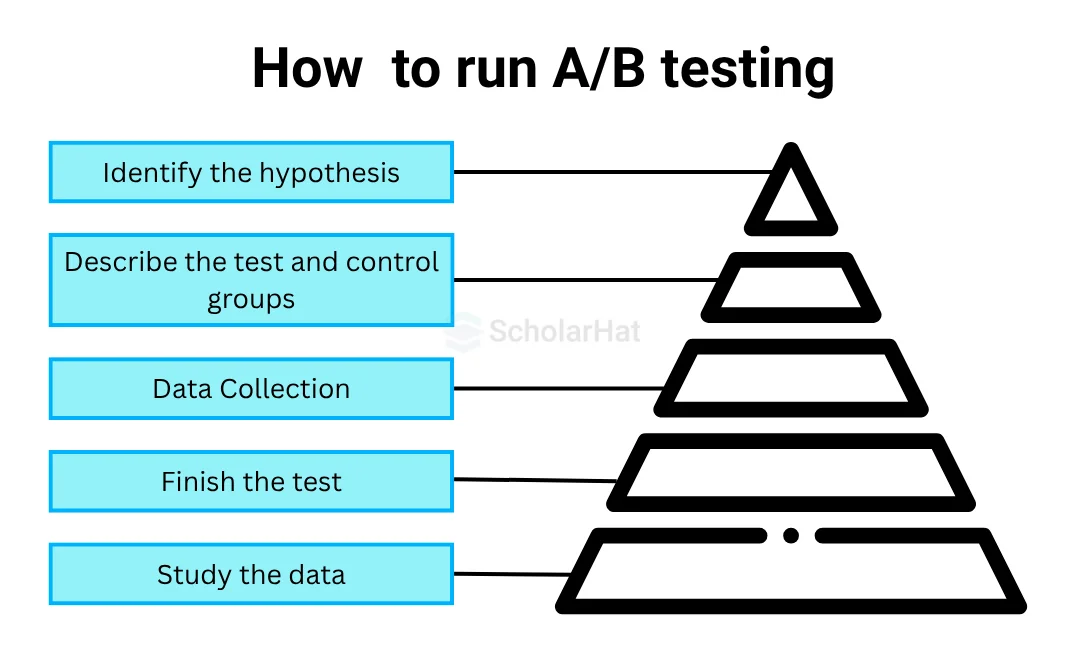
It is a valuable tool for marketers and website owners who want to improve their conversion rates. The steps below should be followed how to run this testing:
- Identify the hypothesis: Choose the theory you want to test. For example, if you wish to test how a new website design affects user engagement, your hypothesis can be "The new website design will increase user engagement by 20%."
- Describe the test and control groups: Randomly split your sample group into two equal portions. The old website design will be distributed to one group (the control group), and the updated website design will be distributed to the other group (the test group).
- Data collection: Gather information about the effectiveness of each version. The information gathered ought to support your hypothesis. For instance, useful information can include bounce rates, time spent on the website, or click-through rates if your hypothesis is to boost user engagement.
- Study the data: Utilise statistical software to examine the data gathered. For each group, determine the mean and standard deviation. Which version performs better can be determined using statistical significance.
- Finish the test: Finish the test by deciding whether to accept or reject the hypothesis. The hypothesis is accepted if the test group outperforms the control group. The hypothesis is disproved if the test group performs worse than the control group.
Analyzing and interpreting A/B testing results
- Conversion rate: The percentage of users who complete the desired activity, such as making a purchase or signing up for a service, is known as the conversion rate. Calculate and contrast the conversion rates for each version.
- Confidence interval: The confidence interval is a set of numbers that is most likely to include the metric's actual value. A small confidence interval suggests more dependability of the findings.
- Statistical significance: To ascertain whether or not the results are the result of chance, statistical significance is used. If the p-value is less than 0.05, the findings are considered statistically significant.
Analyzing and interpreting the findings of an A/B test is important. The essential metrics to take into account when examining the results of this testing are as follows:
Tools for A/B test in data science
In data science, a variety of technologies are available for this testing. Among the well-liked tools are:
- Google Optimise: Google Optimise is a free tool that enables you to run this testing on your website.
- Optimizely: Testing tools with extensive functionality can be found in Optimizely, a premium tool.
- VWO: Testing features offered by VWO, a premium service, include heatmaps and user recordings.
Common mistakes to avoid in A/B testing
This can be difficult, especially if you are just getting started with data science. When conducting testing, the following errors should be avoided:
- Too many variables are being tested: Equivocal Results can result from testing too many factors at once. One variable must always be tested at a time.
- Ignoring statistical significance: Neglecting statistical significance can result in erroneous inferences. To ascertain whether the version works better, statistical significance is a necessity.
- Not enough data is gathered: Results that are not dependable can stem from not gathering adequate data. A sufficient amount of data must be gathered to make wise decisions.
Best practices for A/B testing in data science
It is essential to adhere to best practices to run successful A/B tests. Best practices for testing in data science include the following:
- Establish precise objectives: Before starting an A/B test, establish clear objectives. Set an improvement goal for the metrics you want to enhance.
- One variable at a time should be tested: Test just one variable at a time to prevent ambiguous findings.
- Gather sufficient data: Amass enough information to enable you to make wise selections. Your results will be more accurate the more data you gather.
- Incorporate statistical significance: Which version performs better can be determined using statistical significance.
Summary
A/B testing is a potent data science tool that aids in the making of data-driven decisions by organizations. Understanding the fundamentals of testing, how to run a typical A/B test, and how to evaluate and interpret the findings are all important components covered in a Data Science Course. Businesses can optimize their goods and services, resulting in more sales and happier clients, by adhering to best practices and avoiding frequent mistakes.