


31
JulData Pre-processing
02 Aug 2025
Beginner
3.89K Views
9 min read

Learn with an interactive course and practical hands-on labs
Data Science with Python Certification Course
Introduction
Data pre-processing, which entails converting raw data into a format appropriate for analysis and modeling, is an essential step in the field of data science for beginners. It is an essential stage in the data science pipeline, as the pre-processing steps have a significant impact on the accuracy and dependability of the outputs of data analysis.
What is data cleaning in data science?
The process of locating and fixing or deleting errors, inconsistencies, & inaccuracies in datasets is known as data cleaning in data science, sometimes known as data cleansing or data scrubbing. In the discipline of data science, it is an important step in getting the data ready for analysis. To make sure the data is correct, full, and dependable, data cleaning entails using a variety of approaches and methodologies.
The handling of missing values, the elimination of duplicate entries, the correction of inconsistent data, the standardization of data formats, and the validation of data against specified standards are all tasks that fall under the category of data cleaning. Data cleaning aims to raise data quality by making sure it is dependable, consistent, and analytically sound.
Why is data cleaning important?
The following are some reasons why data cleaning is important:
- Basis of analysis: Any data science study or model must start with clean, correct data. Inaccurate or flawed data might produce unreliable outcomes and insights. Data cleaning ensures reliable results.
- Reducing bias and error: Data gathered from multiple sources may have discrepancies, human errors, technical issues, or data input problems. Cleaning the data reduces these inaccuracies, lessens bias, and makes sure that the analysis is based on trustworthy data.
- Efficiency improvement: Data scientists can concentrate on necessary information for analysis by removing irrelevant or unneeded data through cleaning. This improves the extraction of valuable insights from the data and saves time and money.
Read More - Best Data Science Interview Questions
Types of data
When processing data in data science, a variety of data kinds and data sources are used. The most frequently used types of data in data science are listed below:
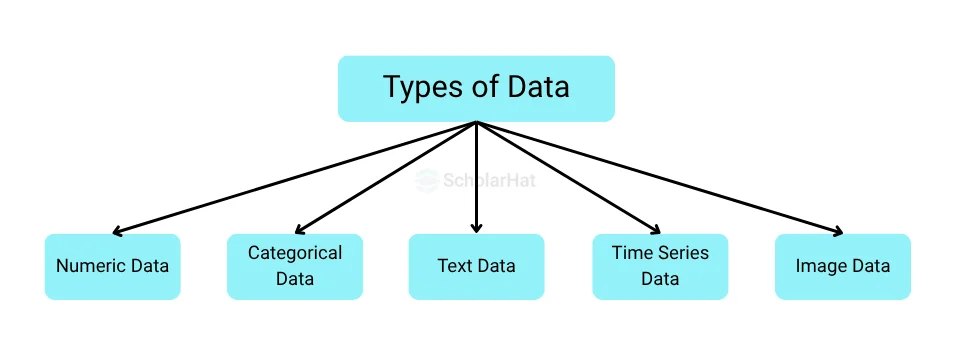
- Numeric data: Handling outliers, missing values, and scaling are necessary.
- Categorical data: Includes handling missing categories, standardizing categories, & encoding variables.
- Textual data: entails operations like stopping words, lemmatization, and handling special characters.
- Time-series data: Emphasises addressing missing values, smoothing the data, & identifying patterns and trends.
- Image data: Visual data that can be analyzed using computer vision algorithms include images, movies, and satellite images.
Types of data sources
Here are a few types of data sources:
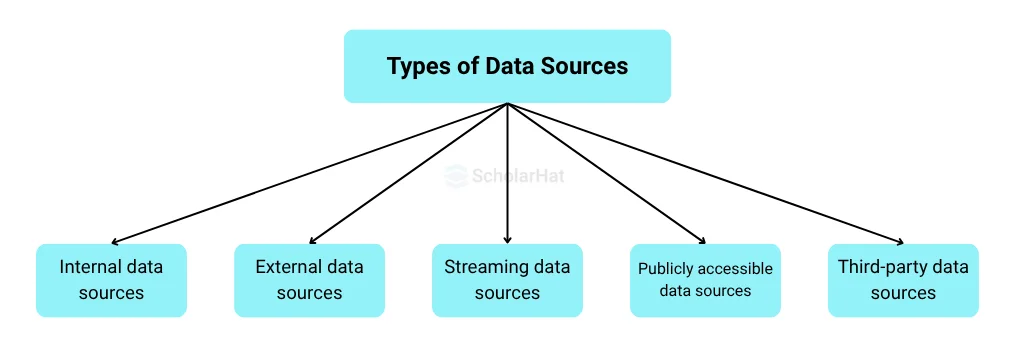
- Internal data sources: These include information produced by an organization, such as financial, customer, and sales data.
- External data sources: These sources of information come from outside of the organization and may include social media, public datasets, and government information.
- Streaming data sources: These sources include continuously produced real-time data, such as data from sensors, feeds from social media, and financial data.
- Publicly accessible data sources: These include open data repositories that give free access to datasets for study and analysis, like Kaggle, the UCI Machine Learning Repository, or Data.gov.
- Third-party data sources: These sources include data that has been purchased or licensed from independent third parties, including marketing, demographic, and consumer behavior data.
Data cleaning and data preprocessing techniques
In order to ensure the precision and reliability of the data, a variety of approaches and methodologies are employed in the data-cleaning process in data science. Typical data cleaning & data preprocessing techniques include:
- Managing missing values: Missing values can appear in datasets for a variety of reasons, including mistakes in data collection or data entry. Imputation approaches like mean imputation, median imputation, or more sophisticated techniques like regression imputation or K-nearest neighbors imputation are used to handle missing information.
- Duplicate record deletion: When information is gathered from many sources or when data entry mistakes are made, duplicate records may appear. Identifying duplicate records based on important features, then eliminating or merging them, is the process of removing duplicate records.
- Correcting incorrect data: Data that contradicts or deviates from established norms is considered inconsistent. Finding inconsistencies, resolving conflicts, and guaranteeing data consistency are all necessary steps in the correction of inconsistent data.
- Creating uniform data formats: Data from many sources may have a variety of forms or units. Data must be transformed into a uniform format or unit for consistency and comparability by standardizing data formats.
- Validating data against predefined constraints: To make sure that data satisfies certain requirements, data must be validated against predefined constraints. This assists in finding data abnormalities and inaccuracies.
Data cleaning tools
There are many solutions for data cleansing that can make the process simpler and automate particular processes. Tools used to clean data include:
- OpenRefine: An effective open-source program with a simple user interface for data cleansing, OpenRefine. It offers many data-cleaning procedures, including resolving missing values, getting rid of duplicates, and changing data.
- Trifacta Wrangler: Trifacta Wrangler is a data cleansing and transformation tool with cutting-edge capabilities. Large datasets can be cleaned quickly and easily since it offers a visual interface for studying and cleaning data.
- Python libraries: Numerous functions and techniques for data cleaning are offered by Python libraries like Pandas, NumPy, and SciPy. These libraries give data scientists the tools they need to effectively manage missing information, get rid of duplicates, and handle other data cleaning chores.
- R packages: There are many data cleaning packages available for R, a prominent computer language for data analysis. Functions and tools for handling missing values, getting rid of duplicates, and manipulating data are provided by packages like dplyr and tidyr.
- Excel: The tool of choice for data cleansing and analysis is Microsoft Excel. It has built-in tools and functions for handling missing values, getting rid of duplicates, and doing simple data cleaning.
Sampling in data science
Sampling in data science is an essential pre-processing technique because it allows data analysts to engage with a smaller group of data without sacrificing the precision and quality of the study. Additionally, data sampling can aid in reducing the computing complexities of the analysis, improving its effectiveness and speed of execution.
Data science uses a variety of sampling approaches, including:
- Random Sampling: Using this strategy, data points are chosen at random from the dataset, giving each one an equal opportunity for selection. When attempting to generate a sample that is representative of the full dataset from a huge dataset, random sampling is helpful.
- Stratified Sampling: This strategy involves selecting a sample at random from each group after stratifying the dataset into various groups or stratification based on a certain characteristic, such as age or gender. When the dataset is uneven or has an irregular distribution, stratified sampling helps to ensure that the number of samples is accurately representing the complete dataset.
- Cluster Sampling: Using this strategy, a random sample is chosen from each cluster after the dataset has been divided into numerous clusters depending on a certain criterion, such as geographical region or customer segment. When the dataset is excessively big and it would be impractical to choose a random sample across the complete dataset, cluster sampling can be effective.
- Systematic Sampling: Using this method, each nth data point within the dataset is chosen, where n is a number that has been predetermined. When the dataset is organized and the data exhibit a distinct pattern, systematic sampling is advantageous.
Best practices for data cleaning
It is essential to adhere to specific best practices to ensure efficient data cleansing. The following are some of the ideal cleanings of data procedures:
- Create a clear data cleansing plan before you begin: Create a clear plan defining the procedures to be taken, the order of operations, and the anticipated results before beginning the data cleaning process.
- Keep track of the cleaning procedure: The data cleansing procedure should be documented for reproducibility and openness. It makes it possible for others to comprehend and repeat the processes used to clean the data.
- Maintain the original data: Before beginning the cleaning procedure, it is crucial to keep a copy of the original data. This makes it possible to compare the cleaned data with the unaltered data and guarantees that no important information is lost.
- Correctly handle missing values: Missing values can affect the analysis's findings. Based on the needs of the analysis and the type of data, select the best strategy for managing missing values.
- Validate and evaluate the cleansed data regularly: Validate the cleaned dataset against established rules or constraints after the data has been cleaned. Examine the cleaned data to make sure it satisfies the standards for analysis and is prepared for further analysis.
Summary
We learned about a variety of data science topics in this article, including types of data sources, data cleaning in data science, data preprocessing techniques, sampling in data science, and eda in data science. Data cleansing is a crucial stage in Data Science Certification where mistakes, inconsistencies, and errors in datasets are found and fixed to assure the accuracy, completeness, and dependability of the information. Data scientists can make sure that the analysis and insights drawn from the data are valid and useful by adhering to best practices and using the proper tools and methodologies.