


27
JunTop 50 Data Science Interview Questions and Answers
27 Jun 2025
Career
5.66K Views
34 min read

Learn with an interactive course and practical hands-on labs
Data Science with Python Certification Course
If you’re getting ready for a career in data science, knowing how to handle Data Science Interview Questions and Answers can make all the difference. Companies today are relying more than ever on data to guide their biggest decisions, and they need talented people who can turn numbers into real insights. Whether you're just starting out or aiming for a more advanced role, practicing the right data science interview questions and answers will help you feel more confident and prepared for anything that comes your way.
In this guide, you’ll find some of the most common and important Data Science Interview Questions and Answers that hiring managers love to ask. We’ll cover everything from statistics and machine learning to data analysis, Python coding, and real-world problem-solving tips. Additionally, we'll also delve into Data Science Certification Training and provide a comprehensive Data Science Tutorial to help you enhance your Data Scientist skills. No matter what role you're aiming for, Data Scientist, Data Analyst, or Machine Learning Engineer, mastering these questions will help you stand out and move closer to landing the job you’ve been working toward.
Data Science Interview Questions and Answers for Freshers
Starting your journey in Data Science can feel exciting and a little overwhelming. To help you get interview-ready, here are some simple and important questions freshers are often asked, explained in an easy-to-understand way!
Q.1. How does supervised learning differ from unsupervised learning?
There are two categories of machine learning techniques: supervised and unsupervised learning. Both of them enable us to create models. On the other hand, they are used to various problem types.
The Differences between Supervised Learning and Unsupervised Learning are as follows:
| Supervised Learning | Unsupervised Learning |
| Works with data that is labeled and includes both inputs and the anticipated output. | It operates on unlabeled data or data without any mappings from input to output. |
| Used to build models that can be used to categorize or forecast objects. | Used to take significant information out of massive amounts of data. |
| Supervised learning techniques that are often used include decision trees and linear regression. | Frequently utilized algorithms for unsupervised learning: Apriori algorithm, K-means clustering, etc. |
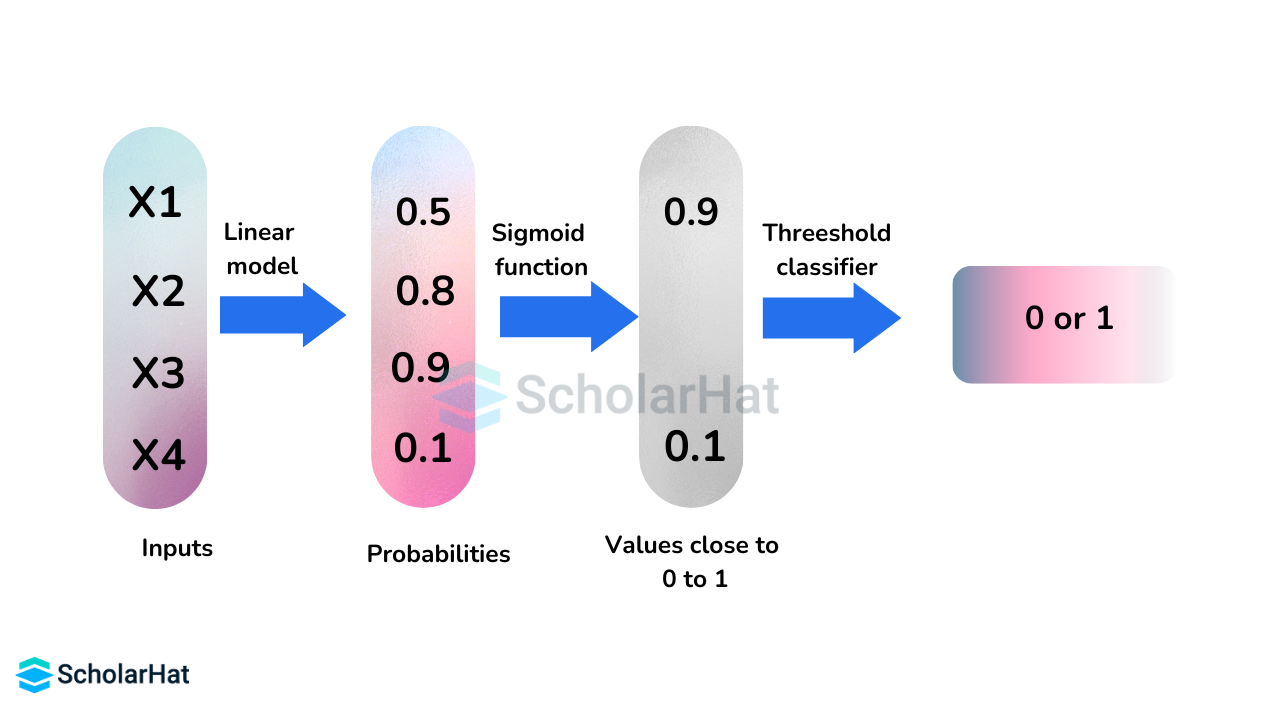
Q.2. What is the process to perform logistic regression?
By estimating probability using its underlying logistic function (sigmoid), logistic regression in data science quantifies the link between the dependent variable, our label for the outcome we wish to predict, and one or more independent variables, our characteristics.
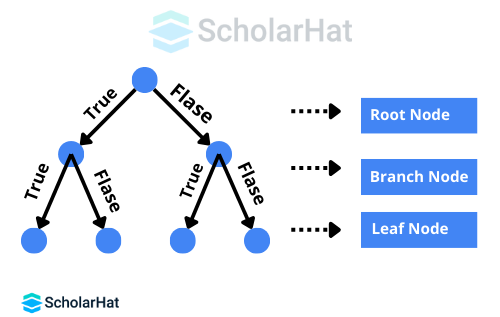
Q.3. Describe how to create a decision tree in detail.
Creating a decision tree involves a clear sequence of steps. In Data Science Interview Questions, you’re often asked to explain this process step-by-step. Here's how you do it:
- Use the complete set of data as input.
- Compute the predictor attributes and the target variable's entropy.
- Compute the information you have gained about all attributes (we have information on how to separate various objects from one another).
- Select the root node based on the property that has the biggest information benefit.
- Until each branch's decision node is decided, carry out the same process on each branch.
Q.4. How do you create a random forest model?
The following are the steps involved in making a random forest model:
- From a dataset containing k records, select n.
- Make unique decision trees for every n data value that needs to be considered. A projected result is obtained from each of them.
- Every conclusion is made via a voting process.
- Whoever's prediction gets the most support will decide the final result.
In Data Science Interview Questions, they often ask you about this because random forests basically get better accuracy by letting lots of trees "vote" together instead of relying on just one.
Q.5. How do you keep your model from overfitting?
A model is considered overfitting if it performs poorly on test and validation datasets after being trained excessively well on training data using model selection in machine learning. You will avoid overfitting by:- Reduce the complexity of the model, consider fewer variables, and reduce the number of parameters in neural networks.
- Using methods for cross-validation.
- Adding additional data to train the model.
- Enhancing data so that more samples are available.
- Ensembling (Bagging and boosting) is used.
- Applying penalization strategies to specific model parameters that are likely to result in overfitting.
Q.6. Make a distinction between analysis that is univariate, bivariate, and multivariate.
Based on how many variables are handled at a time, statistical analyses are categorized.
| Univariate analysis | Bivariate analysis | Multivariate analysis |
| One variable at a time is the only one being solved in this study. | Two variables at a given period are statistically studied in this analysis. | This study examines the responses and deals with statistical analysis of more than two variables. |
| Pie charts showing sales by territory are one example. | For instance, a scatterplot of the study's spending volume and sales analysis. | Example: Research on the association between people's use of social media and their self-esteem, which is influenced by a variety of variables, including age, the amount of time spent on it, employment status, status in relationships, etc. |
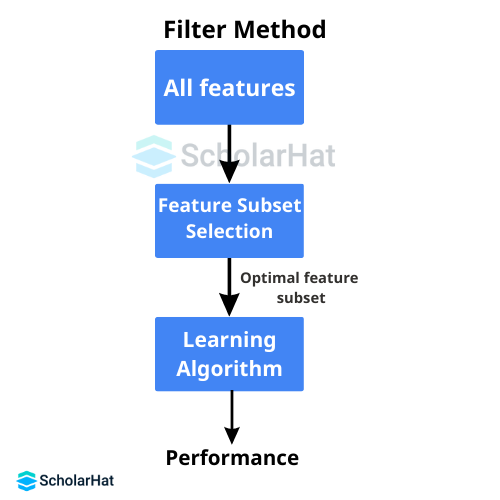
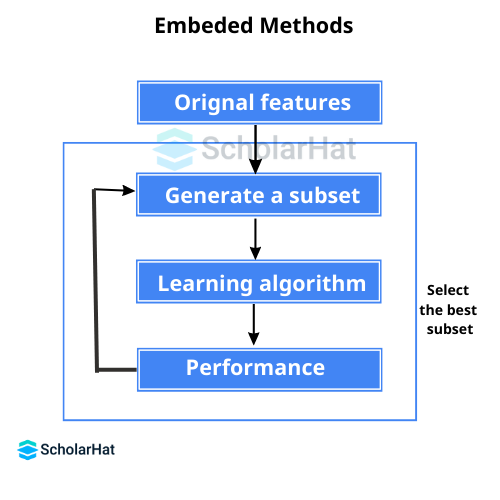
Q.7. Which feature selection techniques are applied to choose the appropriate variables?
Not every variable in a dataset is required or helpful to construct a model when using it in data science or machine learning methods. To make our model more efficient, we need to avoid using redundant models through more intelligent feature selection techniques. The three primary methods used in feature selection in machine learning are as follows:- Filter Methods: The Chi-Square test, Fisher's Score method, Correlation Coefficient, Variance Threshold, Mean Absolute Difference (MAD) method, Dispersion Ratios, and other techniques are examples of filter methods in machine learning.
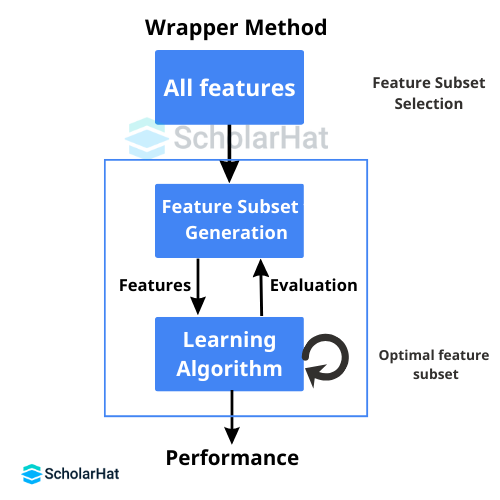
- Wrapper Methods: Three different wrapper methods in machine learning are available. Recursive feature elimination, forward selection, and backward selection.
- Embedded Methods: Random Forest Importance and LASSO Regularisation (L1) are two examples of embedded approaches in machine learning.
Q.8. What is dimensionality reduction, and what are its advantages?
The technique of removing extra or unnecessary variables from a machine-learning environment is called dimensionality reduction. You’ll often hear about this in Data Science Interview Questions because it’s super useful. Reducing dimensionality has a few big advantages:
- It lowers the amount of storage needed for machine learning initiatives.
- Analyzing the output of a machine learning model is simpler.
- When the dimensionality is reduced to two or three factors, 2D and 3D visualizations become conceivable, making the results easier to see.
Q.9. How should a deployed model be maintained?
To keep a deployed model running smoothly, you usually follow a few important steps. In Data Science Interview Questions, you’ll often get asked about this because it shows how well you understand real-world machine learning work:
- Monitor: To ascertain the accuracy of any model's performance, ongoing monitoring is required. When making a change, you should consider the potential effects of your actions. To make sure this is operating as intended, it must be observed.
- Evaluate: To ascertain whether a new method is required, evaluation metrics of the current model are computed.
- Compare: To identify which of the new models performs best, they are put to the test against one another.
- Rebuild: Using the most recent data, the top-performing model is reconstructed.
Q.10. How do recommender systems work?
Based on user preferences, a recommender system forecasts how a user would score a certain product. Recommendation systems in machine learning can be divided into two categories:
- Collaborative Filtering
- Content-based Filtering
Q.11. In a linear regression model, how are RMSE and MSE found?
Among the most widely used metrics to assess a linear regression model's accuracy are RMSE and MSE.
The Root Mean Square Error is denoted by RMSE.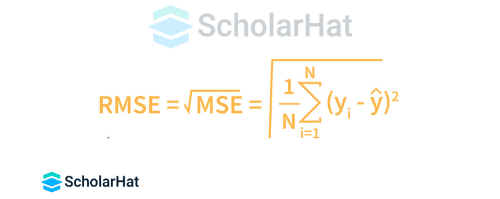
MSE indicates the Mean Squared Error. 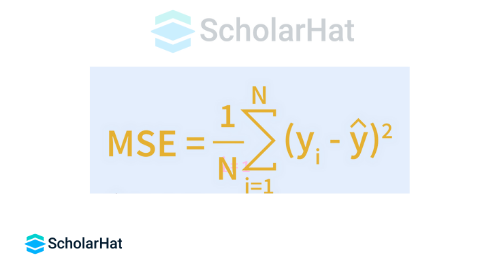
Q.12. How is k to be chosen for k-means?
The elbow method is used to choose k for the k-means clustering. In Data Science Interview Questions, you'll often get asked about this because it's a fundamental technique. The idea behind the elbow method is to apply k-means clustering on the dataset, where 'k' represents the number of clusters. It’s defined as the sum of squared distances between each cluster member and its centroid, which is calculated inside the sum of squares (WSS).
Q.13. What does the p-value mean?
The P-value in data science indicates the likelihood that an observation regarding a dataset is the result of chance. Strong evidence against the null hypothesis and in favor of the observation can be found in any p-value less than 5%. A result's validity decreases with increasing p-value.
Q.14. How should values that are outliers be handled?
When you're analyzing data, you usually filter out outliers if they don’t meet certain criteria. In Data Science Interview Questions, you might get asked about how to deal with them. The tool you’re using often lets you automatically remove outliers by setting up a filter. But here’s the thing, sometimes outliers can actually tell you something important about rare events or low-probability cases. So, analysts might decide to look at and analyze those outliers separately.
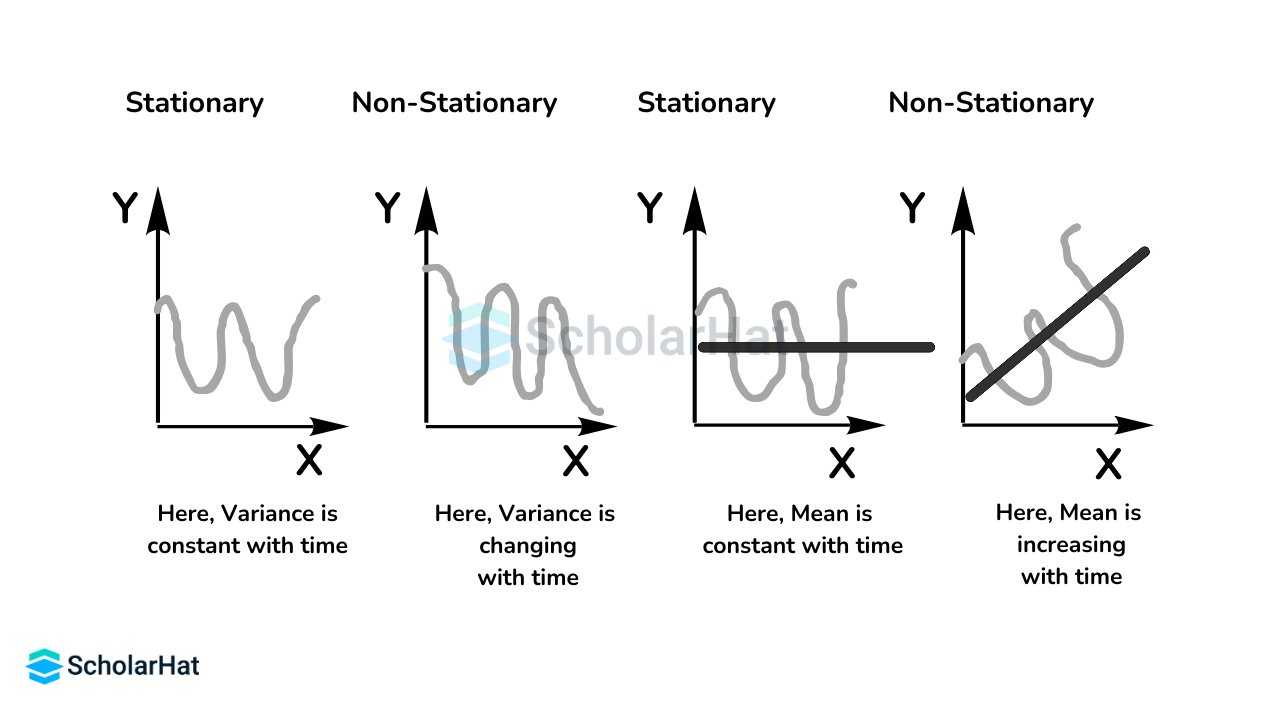
Q.15. How is the stationary status of time series data determined?
When time series data is deemed stationary, it means that the information is being gathered continuously. This could be a result of the data lacking any seasonal or time-based trends in data science.
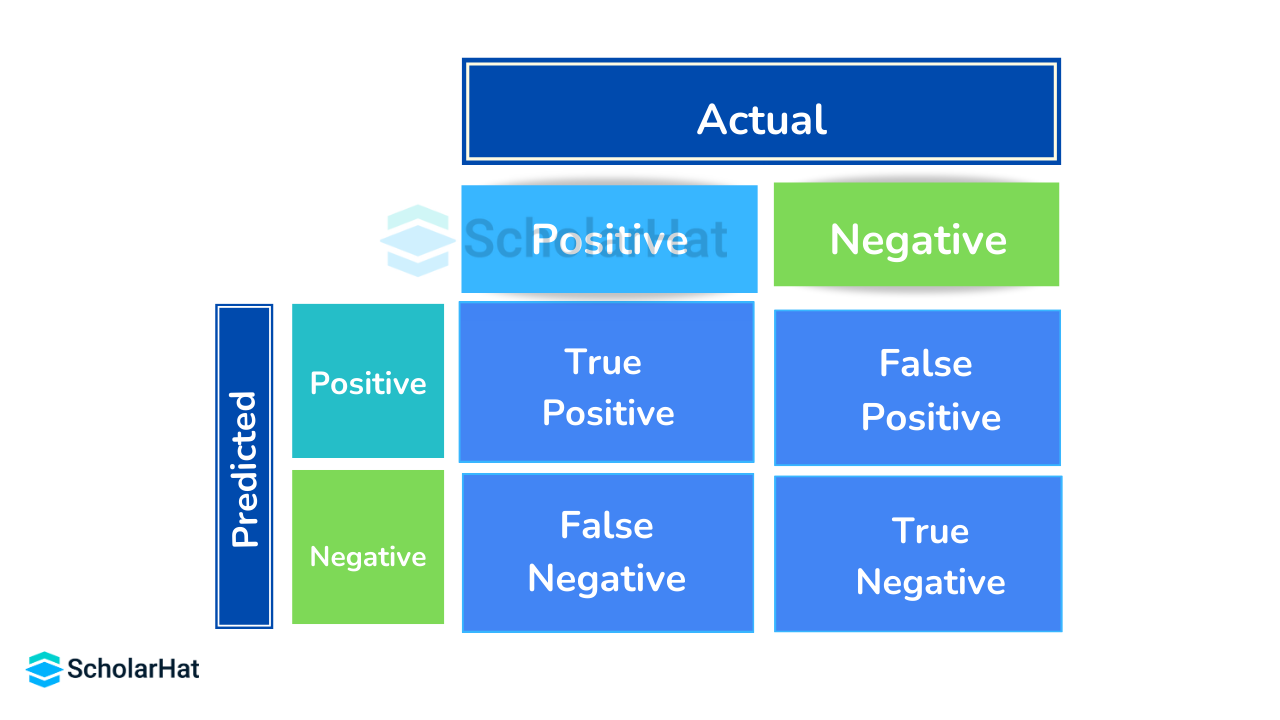
Q.16. How can a confusion matrix be used to calculate accuracy?
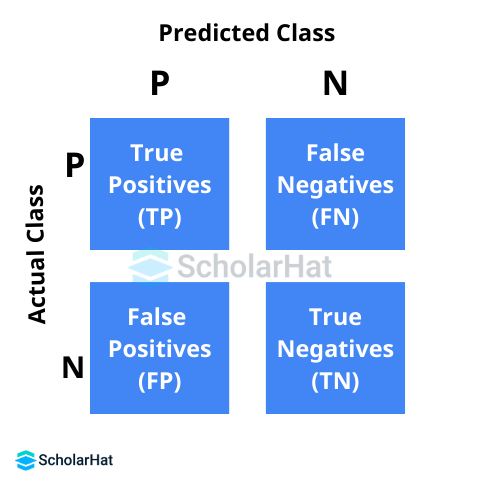
You should know four terminologies associated with confusion matrices. These are:
- True positives (TP): When an outcome was anticipated to be favorable and it turned out to be such
- True negatives (TN): When a bad outcome was anticipated, but the actual result was unfavorable
- False positives (FP): When a favorable result is anticipated but the actual outcome is unfavorable
- False negative (FN): When a good result occurs despite a negative prediction
A confusion matrix can be used to calculate a model's accuracy using the following formula: Accuracy = TP + TN/TP + TN + FP + FN
Q.17. Write the equation of the precision and recall rate.
The precision of a model is given by:
Precision = True Positives / (True Positives + False Positives)
The recall rate for a model is given by:
Recall = True Positives / (True Positives + False Negatives)
A recall rate of 1 implies full recall, and a rate of 0 means that there is no recall.
Q.18. Create a simple SQL query that enumerates every order together with the customer's details.
Typically, order tables and customer tables have the following columns:- Order Table
- Orderid
- customerId
- OrderNumber
- TotalAmount
- Customer Table
- Id
- FirstName
- LastName
- City
- Country
- The SQL query is:
- SELECT OrderNumber, TotalAmount, FirstName, LastName, City, Country
- FROM Order
- JOIN Customer
- ON Order.CustomerId = Customer.Id
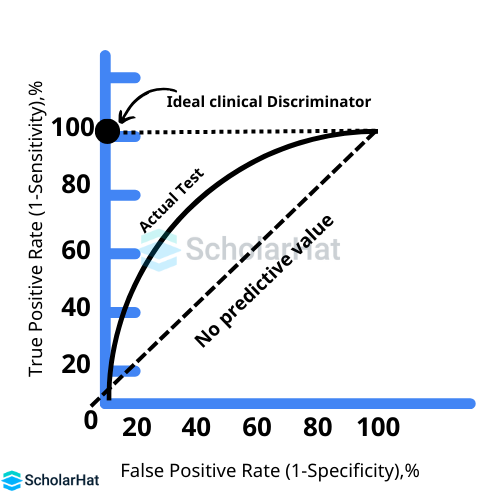
Q.19. What does ROC stand for?
Graphs known as ROC curves show the performance of a classification model at various categorization criteria. The True Positive Rate (TPR) and False Positive Rate (FPR) are plotted on the y- and x-axes, respectively, in the graph. The ratio of actual positives to the total of true positives plus false negatives is known as the true positive rate, or TPR. The false positive ratio (FPR) is the product of the number of false positives and true negatives in a dataset.
Q.20. What is a matrix of confusion?
The summary of a problem’s prediction outcomes is called the Confusion Matrix. In Data Science Interview Questions, you’ll often be asked to explain this because it's a key concept in model evaluation. It’s a table that helps to show how well the model performs. Specifically, an n*n matrix, known as the confusion matrix, is used to evaluate how well a classification model is doing.
Data Scientist Interview Questions and Answers for Intermediate
Ready to take your Data Science skills to the next level? These Data Scientist Interview Questions and Answers for Intermediate professionals will help you dive deeper into real-world concepts and prepare you for tougher interviews!
Q.1. What are the true-positive and false-positive rates?
- Truly POSITIVE RATE: The percentage of accurate predictions for the positive class is provided by the true-positive rate. The percentage of real positives that are correctly validated is also calculated using it.
- FALSE-POSITIVE RATE: The percentage of inaccurate predictions made for the positive class is indicated by the false-positive rate. A false positive is when something that was initially false is determined to be true.
Q.2. How does traditional application programming vary from data science?
Traditional application programming requires the creation of rules in order to convert input into output, which is the main and most important distinction between Data Science & traditional programming. The rules in data science are generated automatically from the data.
Q.3. How do long and wide-format data differ from one another?
The Differences between long-format data and wide-format data are as follows:
| Long Format Data | Wide Format Data |
| A column in a long-format dataset contains the values of the variables as well as potential variable types. | Every variable in wide data, however, has its own column. |
| In the lengthy format, each row denotes a single point in time for each subject. There will be numerous rows of data for each topic as a result. | A subject's repeated answers will appear in a single row in the wide format, with each response in its own column. |
| At the end of each experiment, this data format is most commonly used for writing to log files and R analysis. | This data type is rarely utilized in R analysis and is mostly utilized in data manipulations and statistical software for repeated measures ANOVAs. |
| Values in the first column repeat in a long format. | Values in a wide format don't appear again in the first column. |
| For converting the wide form to the long form, use df.melt(). | Use df.pivot().reset_index() for converting the long form into wide form |
Q.4. Describe a few methods for sampling.
The following sampling methods in data science are often used:
- Simple Random Sampling
- Systematic Sampling
- Cluster Sampling
- Purposive Sampling
- Quota Sampling
- Convenience Sampling
Q.5. Why does Data Science use Python for Data Cleaning?
Technical analysts and data scientists need to turn huge amounts of data into valuable insights. In Data Science Interview Questions, you might be asked about data cleaning, which is an essential part of the process. Data cleaning involves removing things like malware-infected records, outliers, inconsistent values, unnecessary formatting, and other issues. Some of the most popular Python tools for cleaning data are Matplotlib, Pandas, and others.| Read More: How to Learn Python for Data Science: A Complete Guide |
Q.6. Which popular libraries are used in data science?
The most prevalent libraries in data science include:
- Tensor flow
- Pandas
- NumPy
- SciPy
- Scrapy
- Librosa
- matplotlib
| Read More: Libraries in Python |
Q.7. In data science, what is variance?
Variance tells you how much each value in a dataset differs from the mean, showing how the data points are spread out around the average. In Data Science Interview Questions, you might be asked how variance is used, as data scientists rely on it to understand the distribution of a dataset.
Q.8. In a decision tree algorithm, what does pruning mean?
Pruning a decision tree means removing unnecessary or redundant parts to make it more efficient. In Data Science Interview Questions, you might be asked about this process because a pruned decision tree operates better when it’s smaller, faster, and provides more accurate results.
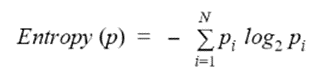
Q.9. What does a decision tree algorithm's entropy mean?
The degree of uncertainty or impurity in a dataset is measured by its entropy. The following formula describes the entropy of a dataset with N classes.
Q.10. What information is gained by using a decision tree algorithm?
The expected decrease is equal to the information gain. Gained information determines how the tree is constructed. The decision tree gains intelligence from Information Gain. Parent node R and a set E of K training instances are included in the information gained. The difference between entropy before and after the split is computed.
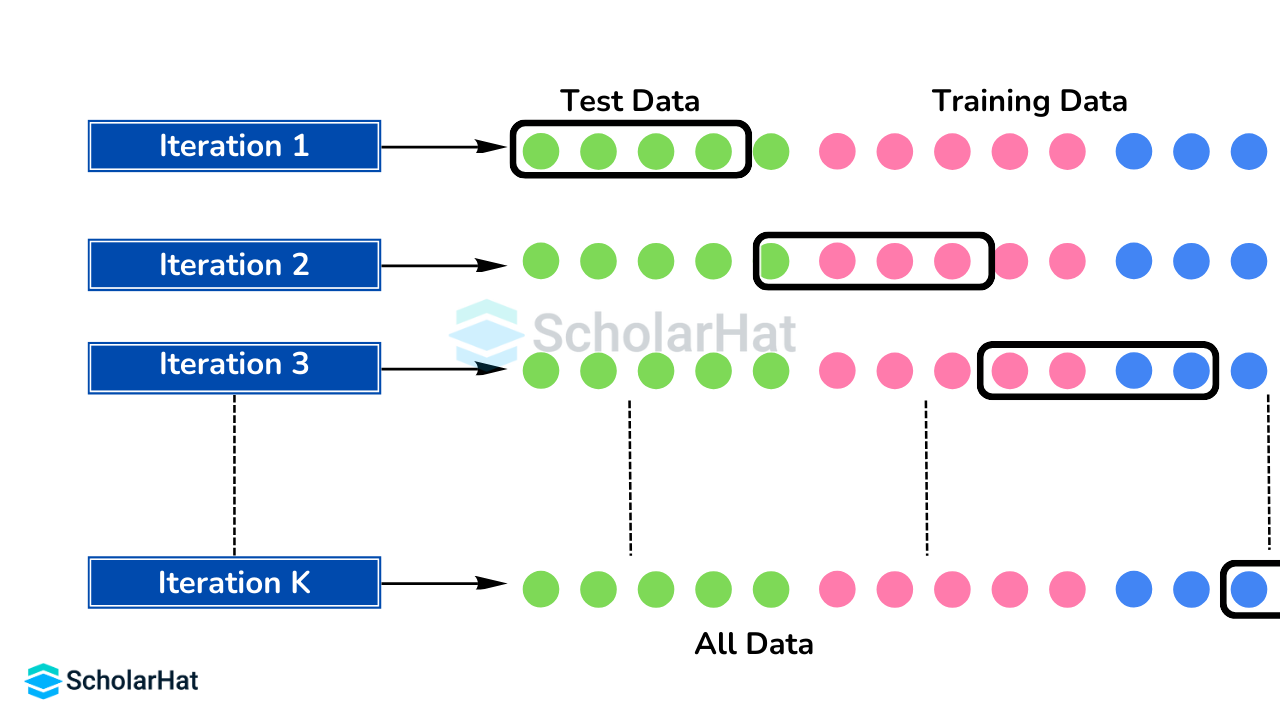
Q.11. What is cross-validation using k-folds?
One method for determining the model's proficiency with fresh data is the k-fold cross-validation process in machine learning. Every observation from the original dataset may show up in the training and testing sets in k-fold cross-validation. While K-fold cross-validation can estimate accuracy, it cannot assist in increasing accuracy.
Q.12. How do you define a normal distribution?
A probability distribution with symmetric values on both sides of the data mean is called a normal distribution. In Data Science Interview Questions, you might be asked about this because it suggests that values closer to the mean are more common, while values far from the mean are less frequent.
Q.13. Describe deep learning.
One of the key components of data science, which includes statistics, is Deep Learning. Working more closely with the human brain and reliably with human thoughts is made possible by deep learning. The algorithms are really designed to mimic the structure of the human brain. In order to extract the high-level layer with the best features, numerous layers are created from the raw input in deep learning.
Q.14. What's a recurrent neural network, or RNN?
An algorithm called RNN (Recurrent Neural Network) works with sequential data. In Data Science Interview Questions, you might be asked about RNN because it's used in applications like voice recognition, image capture, language translation, and more. RNN networks come in different forms, including many-to-one, many-to-many, one-to-one, and many-to-many. For example, Siri on Apple devices and Google Voice Search both use RNN to function.
Q.15. What exactly are feature vectors?
An n-dimensional vector of numerical features used to represent an item is called a feature vector. In Data Science Interview Questions, you might be asked about feature vectors because they’re commonly used in machine learning to mathematically describe the numerical or symbolic properties of an object, which are often referred to as features.
Data Scientist Interview Questions and Answers for Experienced
For seasoned Data Scientists, interviews go beyond basics; they dive into complex problem-solving, scalability, and model optimization. These Data Scientist Interview Questions and Answers for Experienced candidates are crafted to help you tackle advanced concepts with confidence!
Q.1. What are the steps in creating a decision tree?
- Use the complete set of data as input.
- Find a split that optimizes the degree of class distinction. Any test that separates the data into two sets is called a split.
- Apply the split (division step) to the input data.
- Reapply the first and second steps to the separated data.
- When you reach any stopping requirements, stop.
- We refer to this stage as pruning. If you go too far when doing splits, clean up the tree.
Q.2. What is a root cause analysis?
Finding the underlying reasons for certain errors or failures is known as root cause analysis. A factor is deemed a root cause if, upon removal, a series of actions that previously resulted in a malfunction, error, or undesired outcome ultimately function properly. Although it was first created and applied to the investigation of industrial accidents, root cause analysis is today employed in many different contexts.Q.3. How do you define logistic regression?
The logit model is another name for logistic regression in data science. It's a method for predicting a binary result given a linear combination of predictor variables.
Q.4. What is the meaning of NLP?
The abbreviation for Natural Language Processing is NLP. It examines the process by which computers acquire vast amounts of textual information through programming. Sentimental analysis, tokenization, stop word removal, stemming, and tokenization are a few well-known applications of NLP.
Q.5. Describe cross-validation.
One statistical method for enhancing a model's performance is called cross-validation. To make sure the model functions properly for unknown data, it will be rotated, trained, and tested on various samples from the training dataset. After dividing the training data into different groups, the model is repeatedly tested and validated against each of these groups.
Q.6. What does collaborative filtering mean?
The majority of recommender systems use several agents, multiple data sources, and collaborative viewpoints to filter out information and patterns.
Q.7. Do methods for gradient descent always converge to similar points?
They don't since they occasionally arrive at a local minimum or local optimum point. You wouldn't get to the point of global optimization. The data and the initial conditions control this.
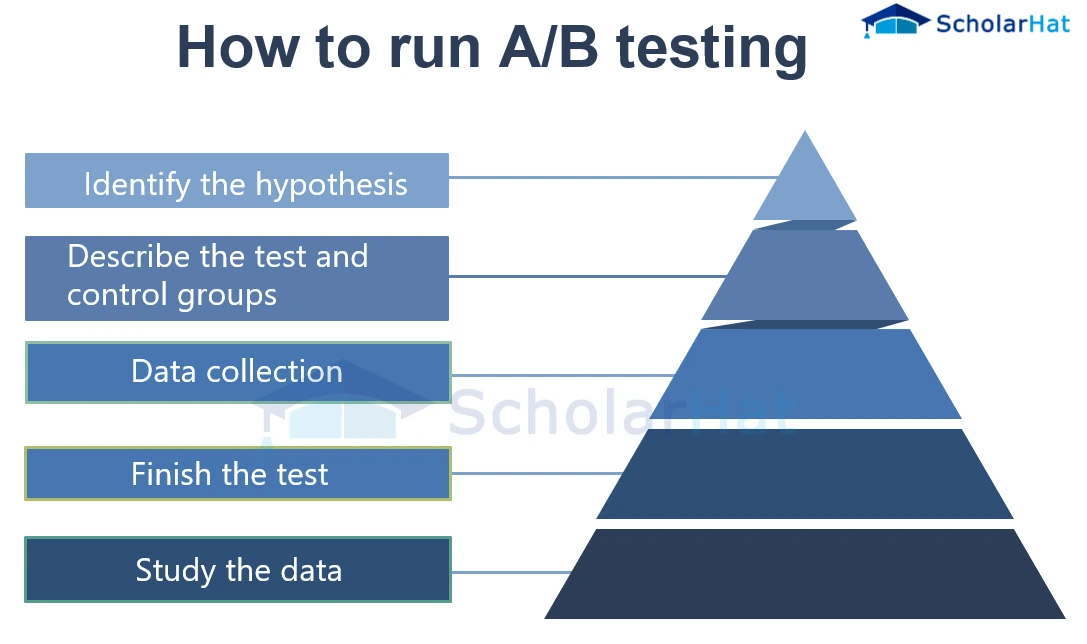
Q.8. What is A/B Testing's purpose?
This is a statistical test of a hypothesis for two-variable randomized experiments, A and B. Finding any adjustments that may be made to a webpage to improve or maximize the results of a strategy is the aim of A/B testing in data science.
Q.9. What are the linear model's drawbacks?
The Linear model's drawbacks are as follows:
- The linearity of the error assumption
- It is not applicable to binary or count results.
- Overfitting issues exist that it is unable to resolve.
Q.10. What is the large-number law?
According to this law of probability, you should experiment a lot, independently of each other, and then average the results to reach a result that is relatively similar to what was expected.
Q.11. What are confounding variables?
Confounders are another name for confounding variables. The extraneous factors in question have an impact on both independent and dependent variables, leading to erroneous associations and mathematical relationships between variables that are related but not in a causal manner.Q.12. What is the star schema?
A database can be organized using a star structure so that measurable data is contained in a single fact table. Because the primary table is positioned in the middle of a logical diagram and the smaller tables branch out like nodes in a star, the schema is known as a star schema.
Q.13. How often should an algorithm be updated?
You may be required to update an algorithm when:
- You require the model to evolve as data streams from the infrastructure
- The underlying data source is changing
- There is a case of non-stationarity
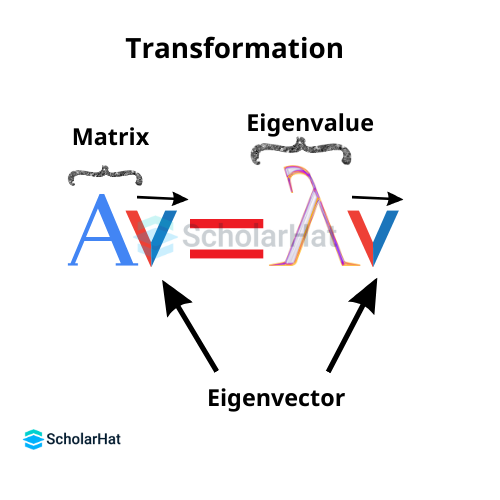
Q.14. What are eigenvectors and eigenvalue?
- Eigenvalues: Eigenvalues are the directions in which a specific linear transformation acts in terms of compression, stretching, or flipping.
- Eigenvectors: The purpose of eigenvectors is to comprehend linear transformations. In data analysis, the eigenvectors of a covariance or correlation matrix are typically computed.
Q.15. Why is resampling performed?
Resampling occurs in any of the following situations:
- Determining the sample statistics' correctness by selecting random numbers to replace the original data points or by using subsets of the data that are available.
- Changing the labels on data points in significance tests
- Using random subsets to validate models (bootstrapping, cross-validation)
Summary
This article provides a complete overview of Data Science Interview Questions and Answers for applicants at all levels of experience. It covers key topics such as supervised and unsupervised learning, machine learning techniques, feature selection, dimensionality reduction, model evaluation, and data processing. The questions are well-structured and come with extensive explanations, making it a fantastic resource for anyone preparing for a data science interview or enrolled in a Data Science with Python Certification Course.| Read More: Python For Data Science and AI Certification Training |
| Download this PDF Now - Data Science Interview Questions and Answers PDF By ScholarHat |
Data Science Interview Questions MCQs: Test your knowledge
Q 1: What is the main goal of Data Science?
Question 1 of 10
FAQs
No. Anyone with the desire and commitment can learn data science. There are plenty of resources for beginners, and there are also courses and bootcamps where you can study data science. The math you’ll need as a beginner is quite foundational.
Yes. There is a huge demand for data scientists in various industries, and salaries have also grown commensurately. Data science can also give you the opportunity to contribute to your company in meaningful ways.
If you have a background in math or computer science, then you can transition into data science easily. But if you don’t have this background, then you should give yourself at least six months to get familiar with the math and coding skills that are required.