


26
JunRegression Analysis
02 Aug 2025
Beginner
3.16K Views
9 min read

Learn with an interactive course and practical hands-on labs
Data Science with Python Certification Course
Introduction
Knowing how to analyze data is an essential component of being a data scientist, especially for beginners in data science for beginners. Data scientists utilize the technique of predictive modeling to examine data and forecast future results. Regression analysis is one of the methods used in predictive modeling that is most frequently employed. We will examine the fundamentals of regression analysis in Data Science Certification Course, including its types, procedures, model selection in data science, and best practices, in this comprehensive article.
Why we use regression analysis
Data science requires regression analysis techniques for a number of reasons.
- Identification of links: Regression analysis aids in the discovery and comprehension of links between variables. It enables data scientists to investigate the nature and power of these associations and see how modifications in one of the variables affect another. Regression analysis offers important insights into the fundamental workings of the data by quantifying these associations.
- Forecasting and Prediction: Regression analysis helps data scientists to foresee and make predictions based on the discovered associations. With the values of the independent variables, they are able to calculate the value of the variable that is dependent on fresh or upcoming observations using the regression model. This predictive capacity is especially helpful in a variety of industries, like marketing, economics, and finance, where predicting future outcomes is essential for making decisions.
- Selection of Variables: Regression analysis aids in identifying the significant explanatory variables or predictors that explain the variation in the dependent variable. It enables data scientists to evaluate the relative significance of several independent factors and pinpoint those that have a significant influence on the result. Using this knowledge, variables can be better chosen to create models that are concise and comprehensible.
- Model Assessment: Regression analysis offers a framework for assessing the model's goodness of fit. Data scientists can evaluate how accurately the regression model predicts the future based on the seen data. They can assess the effectiveness of the model and contrast multiple models using a variety of metrics, including the coefficient of prediction (R-squared), the mean squared error (MSE), and the root mean square error (RMSE).
- Causal Inference: Regression analysis can aid in determining the causes of differences between variables, even though correlation does not imply causality. Data scientists may determine causal effects or pinpoint elements that have a causal bearing on the outcome variable by carefully planning the study, accounting for confounding variables, and employing suitable regression procedures.
- Support for Decision-Making: Regression analysis offers data-driven proof and insights that can aid in the decision-making process. Data scientists can offer useful information to stakeholders and aid in their decision-making by analyzing the correlations between variables, formulating forecasts, and assessing the significance of predictors.
Read More - Data Science Interview Questions And Answers
Types of regression analysis:
To describe the link between the dependent variable & a number of independent variables, data scientists can employ a variety of regression approaches. Types of regression analysis that are often used include:
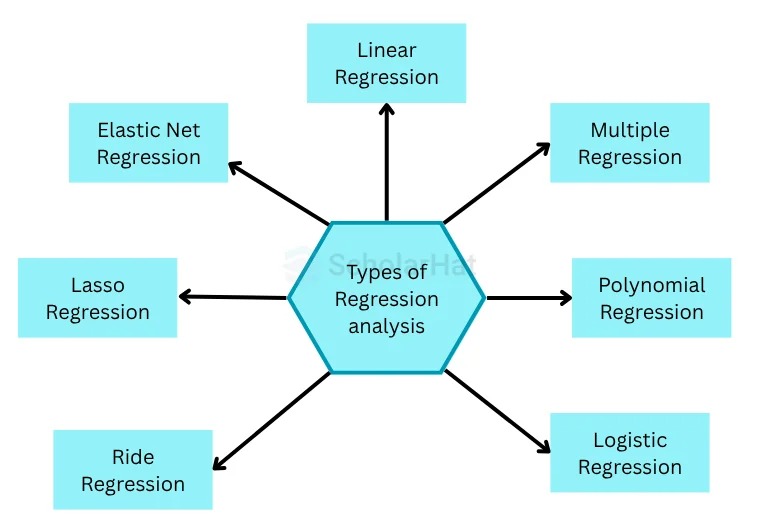
- Linear Regression: The dependent variable & a number of independent variables are modeled by a linear function in the straightforward and often employed approach of linear regression. The relationship that exists between the variables has been assumed to be linear, which means that changes in the independent variable will always have an impact on the dependent variable.
- Multiple Regression: By enabling the modeling of the relationship between the dependent variable as well as two or more independent variables, multiple regression expands linear regression. When there are several influences on the dependent variable as well as each independent variable has a varied effect on the result, this strategy can be helpful.
- Polynomial Regression: A polynomial function is used in polynomial regression to represent the connection between a dependent variable & one or more independent variables. When a straight line cannot accurately depict a non-linear relationship between two variables, it might be helpful.
- Logistic Regression: When the variable that is dependent is binary or categorical, logistic regression is the method of choice. With a logistic function, that converts the variables that are entered to a probability between 0 and 1, it simulates the connection between the variable that is dependent and any number of independent variables.
- Ridge Regression: Regression with Ridge is a regularisation method that prevents overfitting by adding a penalty element to the linear regression objective function. When the model prefers to suit the data noise and has a high variance, it is helpful.
- Lasso Regression: This regularisation method leverages the absolute significance of the coefficients of regression while still adding a term of penalty to the objective function. It is helpful when the model tends to fit several irrelevant features and has a high variance.
- Elastic Net Regression: To balance bias and variance, elastic net regression combines ridge & lasso regression with both L1 and L2 regularisation. When the number of pertinent characteristics is uncertain and the dataset contains a large number of features, it is helpful.
Model selection in data science :
In data science, model selection entails selecting the most suitable algorithm or model to address a particular issue or derive predictions from data. Selecting a model that performs well on untested data and generalizes well to fresh observations is the objective. These are the main steps in process of the model selection in data science :
- Describe the issue: Understand your objectives and the issue you are attempting to fix in great detail. Determine whether the issue is one of classification, regression, grouping, or any other kind.
- assemble and prepare data: Gather information that is pertinent to your problem area, then preprocess it by dealing with missing values, outliers, data normalization, feature scaling, and, if necessary, encoding categorical variables. Create training and test sets from the data.
- Decide on the evaluation metrics: Based on the nature of the problem and the objectives you hope to accomplish, choose the appropriate evaluation measures.
- Select a group of potential models: Choose a group of probable models that are appropriate for your issue. This could involve, among other things, ensemble methods, support vector machine (SVM), random forests, decision trees, logistic regression, and linear regression. Think about the models' qualities, like understanding, complexity, and scalability.
- Model training and evaluation: Each model should be trained using the training data, and its performance should be assessed using the proper evaluation metrics on the testing data. In this step, model performance is estimated using cross-validation or a different validation set.
- Compare models and pick the best one: Examine the effectiveness of various models using the evaluation metrics. Think about things like precision, durability, readability, computational effectiveness, and simplicity of implementation. Select the model that meets the precise criteria of your problem and performs the best on the evaluation measures.
- Adjust the chosen model: The best model can then have its hyperparameters further optimized using methods like grid search, random search, or Bayesian optimization. The model's performance and generalization skills are enhanced by this phase.
- Test the model: After final adjustments, test the model on a different validation set to obtain an accurate assessment of its performance. Make sure the model performs consistently and to your satisfaction.
- Deploy the model and keep an eye on it: Once you're happy with how well the model is doing, put it into a production environment and keep an eye on it constantly. Review the model's performance frequently, and if required, think about retraining or updating it.
Diagnostics in regression analysis:
Evaluation of the regression model's reliability and validity is a component of regression analysis diagnostics. Identifying potential model flaws including outliers, deciding observations, nonlinearity, heteroscedasticity, and multicollinearity is the aim. Here are a few typical diagnostic methods for regression analysis:
- Analysis of residuals: Examining the residuals of the regression model, or the discrepancies between the observed as well as projected values, is known as residual analysis. Residual plots can exhibit heteroscedasticity or patterns that point to model misspecification. One can find the model that generates the most random & homoscedastic residuals by comparing the residuals across many models.
- Finding outliers: An outlier is an observation that dramatically differs from the rest of the data. The performance of the regression model can be significantly impacted by outliers, thus they must be properly recognized and dealt with. Examining leverage plots, Cook's distance and studentized residuals are common methods for outlier spotting.
- Influential Observation Detection: Data points with a significant impact on the parameters and predictions of the regression model are known as influential observations and can be found using the technique of influence observation detection. It's important to recognize and respond to such insights in the right way. Examining leverage plots, Cook's distance and DFFITS are common methods for locating influential observations.
- Finding nonlinearity: Nonlinearity is the detection of a nonlinear relationship between dependent and independent variables. Nonlinearity can result in inaccurate predictions and estimates. Examining residual plots, fitted vs. real plots, & partial regression plots are common methods for spotting nonlinearity.
- Finding heteroscedasticity: When the variance for the residuals varies depending on the independent variable's level, heteroscedasticity is present. Poor predictions and skewed estimates can result from heteroscedasticity. Examining residual plots, scale-location plots, & Breusch-Pagan tests are common methods for spotting heteroscedasticity.
- Multicollinearity detection: Multicollinearity happens when independent variables have a significant degree of correlation with one another. Multicollinearity can produce shaky estimates and inaccurate forecasts. Analyzing correlation matrices, inflation factors with variance (VIF), & condition indices are common methods for spotting multicollinearity.
- Model Fit Assessment: This process comprises assessing the regression model's goodness-of-fit. Examining R-squared, modified R-squared, root mean squared error (RMSE), & residual standard error (RSE) are typical methods for evaluating model fit.
Summary:
Regression helps in the understanding of variable relationships in data science, facilitating prediction and decision-making. Elastic net and logistic techniques, among others, predict, select variables, evaluate models, and infer causality. Information affects selection. Using cross-validation and stepwise regression, the best model was selected. Diagnostics assess the quality of the model, addressing problems and enhancing fit by employing residual analysis, outlier detection, etc. You can also Consider enrolling in our Data Science Certification Training for more information.