


25
JunStatistical Inference and Hypothesis Testing
02 Aug 2025
Beginner
3.91K Views
8 min read

Learn with an interactive course and practical hands-on labs
Data Science with Python Certification Course
Introduction
Statistical inference in Data Science Online Training, which involves the application of probability and statistics, enables us to extrapolate information about a population from a sample. It entails applying statistical methods to draw conclusions and make generalizations about a wider group. A crucial step in statistical inference is hypothesis testing, which enables us to evaluate the veracity of assumptions and decide if there is sufficient data to accept or reject a claim about a population parameter. To learn Data Science to calculate test statistics and p-values, we must first formulate a null hypothesis and gather sample data. These techniques offer a disciplined framework for deriving significant findings from the data and making accurate forecasts.
Probability & Statistics
- Probability: Quantifying the likelihood that various outcomes in uncertain situations will occur is the focus of probability.
- Statistics: Statistics is the process of gathering, analyzing, interpreting, and presenting data in order to reach conclusions and make wise judgments.
Read More - Data Science Interview Questions
Statistical Inference in data science
Using a sample of data from a population, statistical inference is the process of making judgments about that population. It is an essential technique in data science because it enables us to conclude a population even when we just have access to a sample. Numerous industries, such as healthcare, banking, business, and many more, use statistical inference.
Understanding Probability and Probability Distributions
In data science, probability and statistics play crucial roles as they are ways to quantify uncertainty, evaluate the likelihood of an event, and make data modelling and population inferences possible. Probability measures the possibility of an event occurring randomly. Statistical inference is greatly aided by probability distributions, which are mathematical formulas for result likelihood. Data scientists are better able to understand, evaluate, and draw conclusions from complicated datasets when probability and statistics are integrated.
Here are a few key points:
- In data science, probability estimates event likelihood and quantifies uncertainty.
- Probability distributions are mathematical formulas that express the likelihood of a given result in random events.
- While continuous probability distributions model continuous events, discrete probability distributions model discrete events.
- To make predictions about the likelihood of an outcome, probability distributions, along with probability and statistics , are crucial tools in statistical inference.
- The normal, binomial, & Poisson distributions are all frequently used in statistical reasoning.
Statistical Inference Definition and Examples
Definition: Drawing inferences about a population based on data and statistical techniques is known as statistical inference. Based on sample data, assumptions are made, and the possibility that those assumptions will come true is evaluated using statistical tests.
Examples
- hypothesis testing in data science: To ascertain the veracity of a population-based hypothesis, one might utilize the statistical technique known as hypothesis testing in data science, which is a part of inference. It is possible to determine if the null hypothesis ought to be accepted in favor of an alternative hypothesis by contrasting sample data with a null hypothesis, which makes a certain assumption about the population.
- Regression Analysis: Modelling and understanding the relationship between variables is done using regression analysis, a statistical technique. Regression analysis in data science makes predictions about the value of one variable depending on the value of another variable by studying data and assisting in determining the direction and strength of the relationship between variables.
Inference Tests and Procedure Statistics
- To derive information about a population from a sample, inference tests are used.
- Non-parametric tests don't make any distributional assumptions, whereas parametric tests presuppose a particular data distribution, such as the normal distribution.
- The t-test, ANOVA test, & chi-square test are examples of common inference tests.
- ANOVA analyses the means of three or more populations, the chi-square test examines the independence of categorical variables, and the t-test compares the means of two populations.
- Determining the research question, choosing the best test, gathering data, running the test, and analyzing the results are all part of the inference method statistics process.
Inference Methods in Data Science
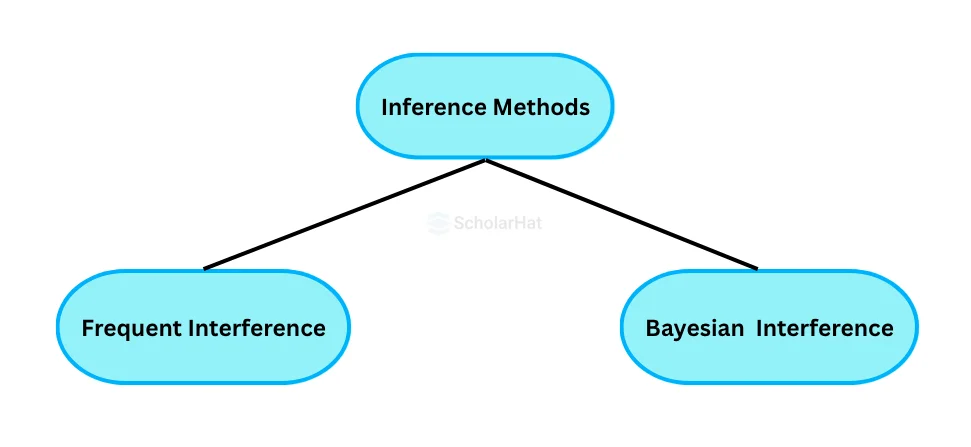
Frequentist and Bayesian inference are the two primary inference techniques used in data science.
- Frequentist inference: Using repeated sampling from a fixed population and random selection from it, frequentist inference is founded.
- Bayesian inference: With Bayesian inference, beliefs are revised in light of new information while taking into account that the population is not fixed and that sample selection is not always random. Due to its capacity to take into account prior knowledge and modify beliefs in light of new information, Bayesian inference is becoming more and more popular in data science.
Statistical Inference in data science and hypothesis testing in data science
The goal of hypothesis testing in data science, an essential element of statistical inference, is to evaluate a population-related hypothesis using sample data. Usually, the null hypothesis is put forth, presuming that a particular demographic trait is true. Contrarily, the alternate hypothesis suggests the reverse. Important points to keep in mind:
- An essential component of statistical inference is hypothesis testing.
- Using sample data in data science involves testing a population-level hypothesis.
- The null hypothesis presupposes the existence of a particular demographic trait.
- The null hypothesis is presented as the alternative hypothesis.
- A frequent hypothesis test used in statistical inference is the t-test.
- The t-test compares the means of two populations and assesses the variation in the data with the difference.
hypothesis testing p value
- Data science requires the hypothesis testing p value.
- Quantifies evidence that is contrary to the null hypothesis, supporting logical conclusions.
- To determine the relevance of the data, compare the p value to the significance level.
- An interpretation that is precisely determined by the hypothesis testing p value.
- Draws conclusions from tests with the null hypothesis.
- Determines whether or not to reject the null hypothesis.
- Essential for understanding whether data supports the hypothesis.
p value calculator from confidence interval
P-values and confidence intervals are crucial statistical concepts measuring result significance. The P-value represents the likelihood of an extreme result under the null hypothesis, while a confidence interval indicates a likely range for the true population parameter based on sample data. Here are some key points about the p value calculator from confidence interval:
Confidence Interval in data science:
- By using the confidence interval in data science, the actual population parameter is estimated.
- They offer a parameter's likely range of values.
- Developed with a specific degree of confidence, such as 95% or 99%.
P-Values
- P-values evaluate a hypothesis test's statistical significance.
- They express how strong the evidence is in opposition to the null hypothesis.
- A lower p-value denotes more compelling evidence that the null hypothesis is false.
Common Errors in Statistical Inference in data science
Common mistakes in statistical inference include:
- Ignoring the sample size, which can result in incorrect conclusions, especially with small sample sizes.
- Without taking into account the statistical test's assumptions, such as the one that data will follow a particular distribution (such as the normal distribution).
- The test results may be deemed invalid if these suppositions are broken.
Best Practices in Statistical Inference in data science
Various best practices should be followed to guarantee the accuracy and dependability of statistical inference. These consist of:
- Considering the research question carefully and using the right statistical test
- A suitable sample size should be chosen.
- The statistical test's underlying assumptions should be carefully considered
- Appropriate data preparation and cleaning
- Results reporting that is concise and clear
Summary
As the basis for statistical inference in Data Science Online Training, probability and statistics are other topics we have studied. We can infer information about a population using statistical inference and a limited sample of data. For effective and trustworthy data analysis, it is essential to comprehend the fundamentals of statistical inference, including probability distributions, hypothesis testing in data science, and inference tests. By adhering to accepted methods for statistical inference, data scientists may make sure their conclusions are accurate and significant. Additionally, tools that help with hypothesis testing and boost the statistical analysis process include p-value calculators that are derived from confidence interval in data science.