


16
JulTime Series Analysis
02 Aug 2025
Beginner
3.56K Views
8 min read

Learn with an interactive course and practical hands-on labs
Data Science with Python Certification Course
Time Series Analysis
Introduction
Effective data analysis becomes more and more important as organizations gather more and more data. Time series data, or data that is gathered over time, is one sort of data that is especially valuable in data science tutorial. Using the time series modeling technique, you may examine this kind of data and forecast future patterns.
Time series Modelling
Time series Modelling is a statistical method utilized in data science to explain and forecast the behavior of a time series of data across time. It entails creating mathematical representations that capture the fundamental dependencies, patterns, and trends found in the data and applying them to predict the future or derive new knowledge.
To successfully analyze, interpret, and use time series data for a variety of applications, time series modeling seeks to understand and show the framework of the data. Making data-driven judgments, anticipating future values, spotting anomalies or outliers, and comprehending the effects of many elements are all included in this.
Understanding the fundamental statistical principles and methods is essential for time series modeling. To recognize and capitalize on the temporal aspect of the data, a combination of statistical evaluation, mathematical modeling, and computational techniques is used.
Read More - Best Data Science Interview Questions
How to Build a Time Series Model
It's important to remember that creating a successful time series model includes statistical knowledge, domain knowledge, & familiarity with the various modeling methodologies. To produce precise forecasts and significant insights from the time series data, it frequently takes a combination of automated algorithms, methods of statistics, & manual fine-tuning.
A model based on time series requires several crucial data science processes to build. Here is a general description of the procedure of Time series Modelling:
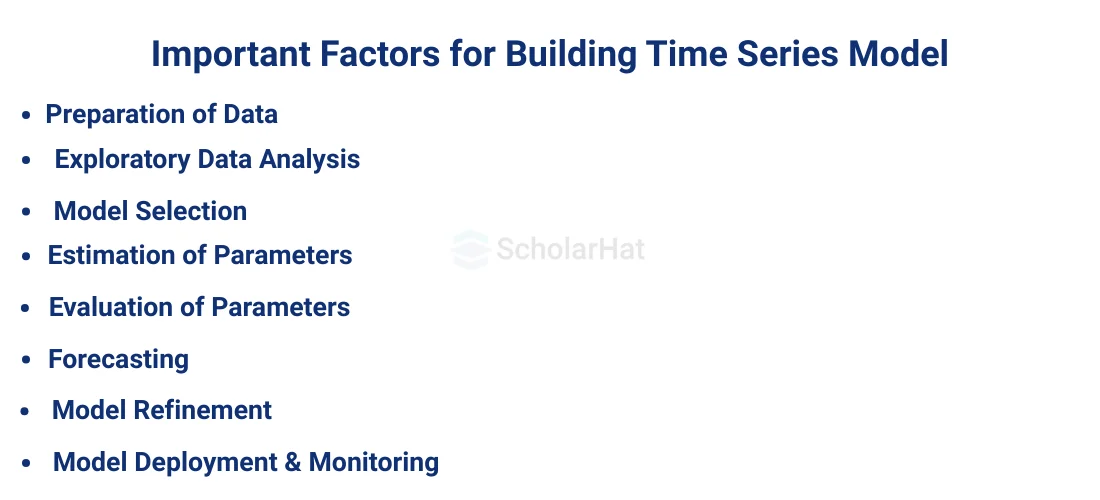
- Preparation of Data: Gather and preprocess the time series data first. This could entail addressing missing numbers, data transformation (such as a logarithmic transformation), and making sure the data is in a format that is appropriate for modeling.
- Exploratory Data Analysis: Performing exploratory data analysis will help you understand the data. Plot the time series to see patterns such as trends, seasonality, outliers, & others. Identifying the data structure at this stage can assist direct further modeling choices.
- Model selection: Select a model that best fits the time series data's properties. Popular approaches include the seasonal ARIMA (SARIMA), autoregressive integrated moving average (ARIMA), exponential smoothing models (like Holt-Winters), and machine learning techniques (like recurrent neural networks). The decision is made based on the data's stationarity, seasonality, and trend existence.
- Estimation of Parameters: Determine the parameters of the selected model using a variety of techniques, including Bayesian, least squares, and maximum likelihood estimation. Finding the values that match the model's predictions to the observed data most closely is the goal of parameter estimation.
- Evaluation and Model Fitting: Analyse the predicted model's performance by fitting it to the time series data. Make sure there are no lingering patterns and systematic errors by examining diagnostic plots, like residual plots, to determine the goodness of fit. To evaluate how accurately the model predicts outcomes, use the relevant assessment measures (such as mean absolute error and mean squared error).
- Forecasting: After the model has been fitted & validated, apply it to the project or forecast the future. Based on discovered dependencies and patterns, forecast the time series' future. Adapt the forecast horizon to the problem's unique requirements.
- Model Refinement: Iteratively improves the model's performance, examine model residuals, and takes into account any other elements that can increase forecast accuracy. This might entail changing model parameters, adding outside variables, or experimenting with different models.
- Model Deployment & Monitoring: After a successful time series model has been created, it can be used to produce continuing forecasts in production settings. As fresh data becomes accessible or if the underlying trends change, track the model's performance over the duration and alter it as necessary.
Seasonal Models
Due to their ability to recognize and take into account the seasonality and recurring patterns present in the data, seasonal models are essential to time series analysis. Time series data frequently displays predictable and regular variations at specified intervals, like daily, weekly, monthly, and yearly cycles. These trends, referred to as seasonality, can have a substantial impact on the time series' behavior and must be taken into consideration in modeling and forecasting.
In order to overcome the difficulties presented by seasonality and enhance the precision of forecasts and insights obtained from time series data, seasonal models were developed. These models offer a better understanding of the underlying factors, assist in identifying the variables driving the seasonality, and produce more precise forecasts by explicitly modeling the seasonal trends.
In time series analysis, seasonal models come in a variety of forms. The data are broken down into trend, seasonality, & residual components using the Seasonal Decomposition of Time Series (STL) strategy, allowing for an independent examination of each component. With the help of seasonal differences and lag factors, the Seasonal ARIMA (SARIMA) model expands the well-known ARIMA model to account for seasonality. Seasonal exponential smoothing techniques take into account both the level & trend components when adjusting the forecast based on past seasonal observations. Other methods used to identify and examine the seasonal trends in the data include Fourier transforms as well as dynamic harmonic regression models.
The properties of the data as well as the precise needs of the research determine which seasonal model should be used. The models may take into account stability, irregularities, as well as interactions with other elements like trends or noise. They may also handle additive and multiplicative seasonality.
Using seasonal models in time series analysis calls for proficiency in statistical methods and a firm understanding of the relevant data and domain. These models help data scientists produce more precise projections, spot seasonal trends, efficiently allocate resources, and make defensible decisions in light of the cyclical structure of the data.
In time series analysis, seasonal models are useful tools because they let data scientists identify and model the predictable variations in the data. These models improve forecasting precision, support decision-making, and planning, and they contribute to an increased understanding of the time series data by adding seasonality.
Every seasonal model has unique advantages and factors to take into account. The type of data from the time series, the features of seasonality, and the particular needs of the research all influence the model that is used. It is crucial to evaluate the strength and consistency of the seasonal patterns & choose the most appropriate model in accordance.
In time series analysis, there are various seasonal model types that are frequently applied:
- Seasonal Decomposition of Time Series (STL): STL is a commonly used technique that breaks down a time series into its fundamental elements, such as trend, seasonality, and residual. It divides the data into additive and multiplicative halves, making it possible to see the seasonal trends more clearly. Individual components can then be broken down and studied or modeled independently.
- Seasonal ARIMA (SARIMA): SARIMA is a seasonality-incorporating version of the autoregressive integrated moving average (ARIMA) model. It considers the seasonal differences, seasonal lag terms, and both the moving average (MA) and autoregressive (AR) components. When seasonal trends are comparatively consistent over time, SARIMA models work well.
- Seasonal Exponential Smoothing: Seasonal components can be added to exponential smoothing techniques like Holt-Winters. Seasonal exponential smoothing methods take into account both the level & trend components when adjusting the forecast based on previous seasonal observations. These models are especially helpful when there is additive and multiplicative seasonality.
- Fourier Transforms: Time series frequency components can be examined using Fourier transforms, a mathematical approach. The main seasonal frequencies can be found and the seasonality can be captured by breaking down a time series into its frequency components. In order to take seasonality into account, Fourier transforms are frequently utilized in conjunction with other modeling techniques.
- Dynamic Harmonic Regression: To describe the seasonality in a time series, dynamic harmonic models of regression integrate regression techniques with Fourier analysis. These models use cosine and sine functions with different coefficients to represent seasonal patterns. Regression techniques are used to estimate the coefficients, along with the model can be dynamically modified as new data become available.
Summary
To identify and model repeating patterns as well as seasonality in data, seasonal models are employed in time series analysis. Seasonal Decomposition of Time Series (STL), Seasonal ARIMA (SARIMA), Seasonal Exponential Smoothing, Fourier Transforms, & Dynamic Harmonic Regression are a few examples of seasonal models. A time series is broken down into trend, seasonality, & residual components using STL. Seasonality is added to the ARIMA model by SARIMA. Forecasts are modified using seasonal exponential smoothing based on past seasonal observations. To identify seasonality, Fourier Transforms examine frequency components. Fourier analysis and regression methods are combined in dynamic harmonic regression. Each model has unique advantages and factors to take into account. Seasonal models help with planning, improve time series data comprehension, and increase forecasting accuracy. The type of model chosen will rely on the data's properties and the needs of the research.